The AI Legibility Divide: A Cross-Industry Institutional Assessment
Summary
This report analyzes 589 companies across 10 industries using the Entity Clarity framework to assess AI legibility, posture, and structural readiness. The findings reveal a widening divide between knowledge-dense industries that benefit from AI interpretation and intermediation-dependent sectors that face structural exposure. The report introduces a Legibility Risk Map and evaluates posture versus capability as a forward indicator of institutional resilience.
Methodology
This assessment aggregates Entity Clarity (ECC) scores, posture classification (Open, Defensive, Blocked), and capability tiers (High, Medium, Low) across 589 companies spanning 10 industries.
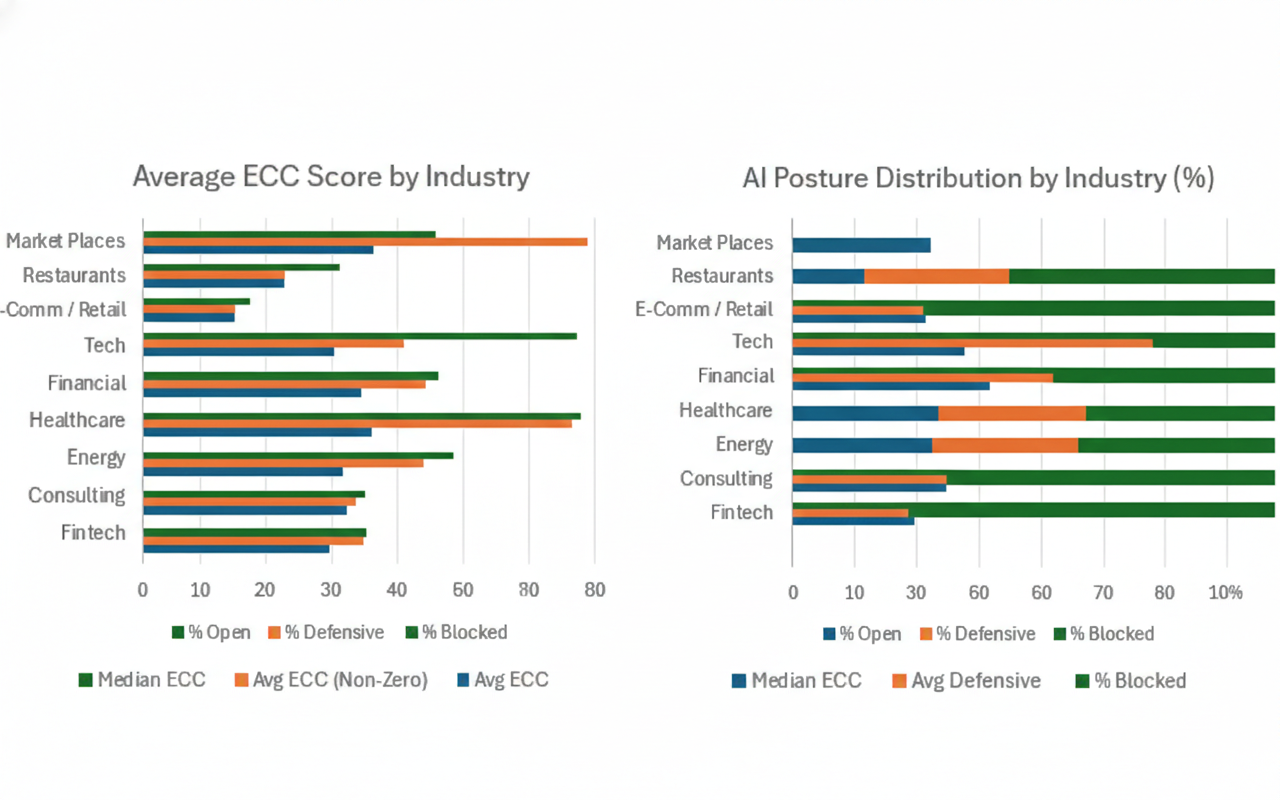
Metrics analyzed:
• Average ECC
• Non-Zero Average ECC
• Median ECC
• Posture Distribution
• Capability Distribution
Industries evaluated:
Fintech, Media, Consulting, Energy, Healthcare, Financial, Technology, E-Commerce/Retail, Restaurants, and Marketplaces.
The objective is not to measure technological sophistication, but machine interpretability and structural legibility within AI-driven discovery systems.
Findings
1. AI Legibility Correlates with Knowledge Density
Industries where value is expressed through explanation, compliance, or structured reasoning score highest. Fintech, Media, and Consulting dominate Tier I.
2. The Media Adaptation Signal
Media ranks second overall. Despite early exposure to AI substitution, it demonstrates strong median ECC (73) and disciplined defensive posture (40%). Adaptation under pressure is visible.
3. The Tech Paradox
Technology ranks sixth. 22% of firms block AI crawlers, and only 13% reach high capability. Many platform-based models view AI interpretation as competitive displacement rather than distribution enhancement.
4. Marketplaces as Structural Laggards
Lowest average ECC (36.7). Highest blocked rate (37%). Minimal high capability (6.5%). Intermediation dependency correlates strongly with defensive restriction.
5. Healthcare and Energy Bimodality
High non-zero averages but elevated blocked rates suggest strategic caution rather than structural weakness. Regulatory complexity shapes posture more than capability.
Landscape
The data reveals a clear three-tier structure.
Tier I – Cognitive / Information-Dense Industries
Fintech (64.5), Media (60.7), Consulting (59.8)
These industries produce structured knowledge, operate in documentation-heavy environments, and benefit from interpretability. AI search amplifies rather than displaces them.
Tier II – Regulated Infrastructure Systems
Energy (52.3), Healthcare (49.4), Financial (47.1)
These industries show moderate legibility with strong bimodal patterns — firms either commit meaningfully or restrict access entirely.
Tier III – Intermediation-Dependent Consumer Industries
Technology (45.4), Retail (42.4), Restaurants (41.1), Marketplaces (36.7)
These sectors rely on aggregation, routing, or attention capture. AI reduces their gatekeeping power, which correlates with lower ECC and higher blocking behavior.
Posture reflects strategic intent. Capability reflects structural readiness.
Four patterns emerge:
Open + High Capability
Future-aligned. These firms benefit from AI indexing and structured interpretation.
Defensive + High Capability
Governed exposure. Institutions balancing crawl access with IP protection.
Open + Low Capability
False openness. Firms exposed but structurally unreadable.
Blocked + Low Capability
Maximum displacement risk. Protection without structural strength.
The future does not reward openness alone.
It rewards interpretability combined with governance.
We assess industries across two axes:
Archetypes
None for this report.
Index
Strategic Implications
Full Report
The cross-industry dataset of 589 companies reveals a systemic reality: only ~15% of firms achieve high AI capability. Average ECC across industries remains below 50.
This indicates broad institutional unreadiness.
The divide is not technological sophistication.
It is structural clarity.
Industries built around explanation, compliance, or structured knowledge score highest. Industries built around routing, aggregation, or attention capture score lowest.
AI legibility correlates positively with informational density and inversely with intermediation dependency.
Media’s ranking validates an adaptive thesis: sectors exposed earliest to AI pressure reorganize fastest.
Marketplaces’ ranking confirms a displacement thesis: sectors whose primary value is routing face the greatest structural compression.
The strategic frontier is no longer digital transformation.
It is machine interpretability.
Institutions must now decide:
Do they compete inside AI discovery systems,
or do they attempt to shield themselves from them?
History suggests the former will compound.
Read the Entity Clarity Industry Reports:
Entity Clarity Report - Technology
Entity Clarity Report - Finance
Entity Clarity Report - Healthcare
Entity Clarity Report - eCommerce & Retail
Entity Clarity Report - Consulting
Entity Clarity Report - Energy
Entity Clarity Report - Payments & Financial Infrastructure
Entity Clarity Report - Marketplaces & Platforms
Entity Clarity Report - Restaurants & Hospitality